
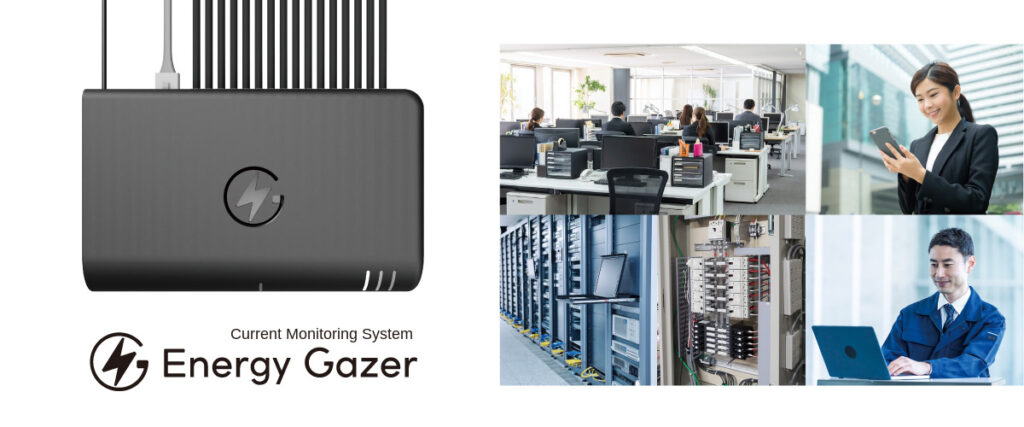
An IoT Current Monitoring Service using the Cloud.
EnergyGazer is a cloud-based IoT current monitoring system that retrofits to existing distribution boards. It monitors up to 16 circuits at 3-second intervals, with PoE power and Web API support.
Because there is no need to replace the distribution board or carry out major modifications, installation costs are kept low.
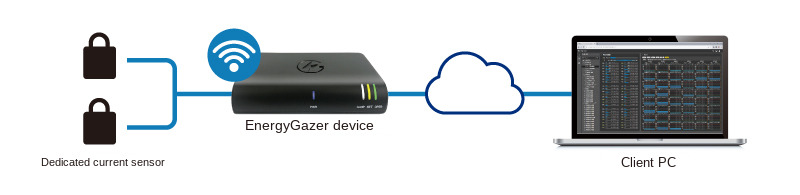
System Image (Cloud Service Model)*
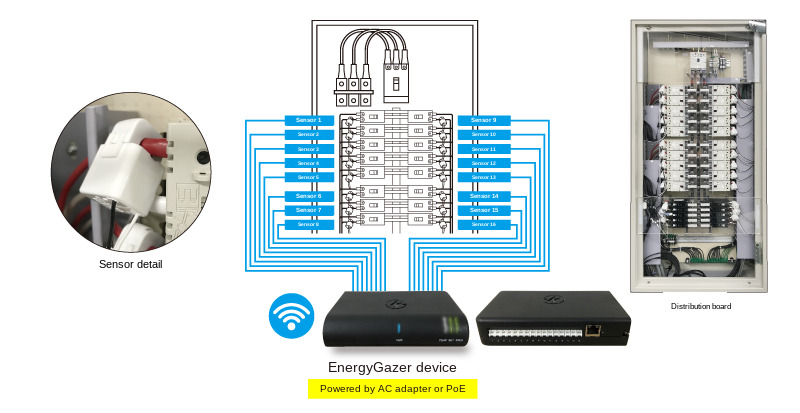
Connect the clamp sensors to the EnergyGazer device and connect it to the Internet.
After registering an account and completing the setup, you can start using the service.
* In addition to the cloud version, an on-premises version that runs entirely within your own network is also available.
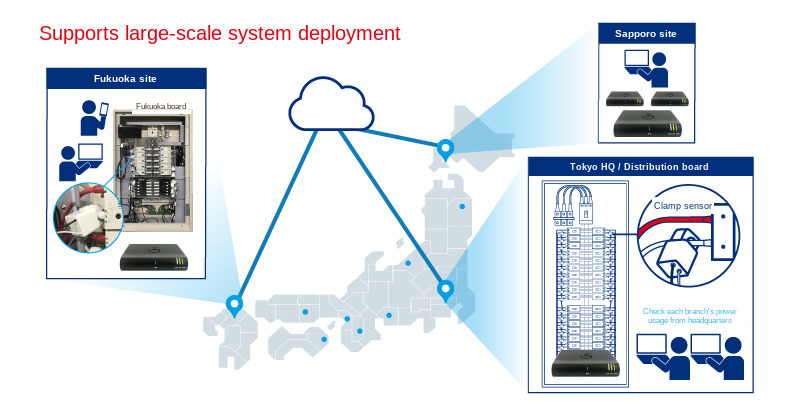
Supports Large-Scale System Deployment
This system enables centralized monitoring of current usage at headquarters across multiple locations nationwide, while also allowing real-time monitoring at each individual site.
Example Use Cases
- Centralized power monitoring for large organizations
- Power monitoring at unmanned sites
- Effectiveness measurement during equipment upgrades
- Monitoring as a countermeasure against internal breaker trips
- Evaluation of equipment deterioration caused by abnormal current levels
- Power interruption detection for devices requiring constant power supply
Features and Functions
User Interface
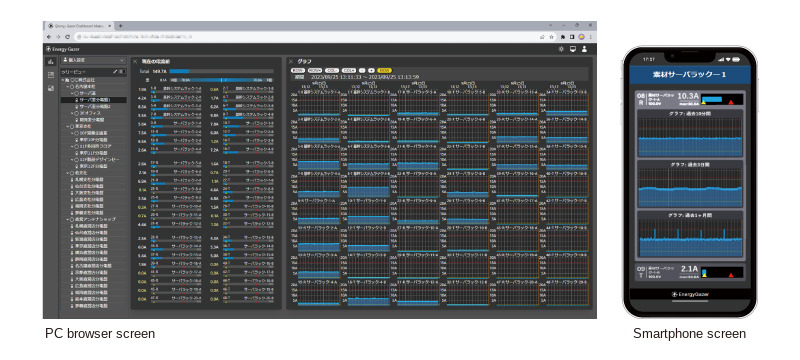
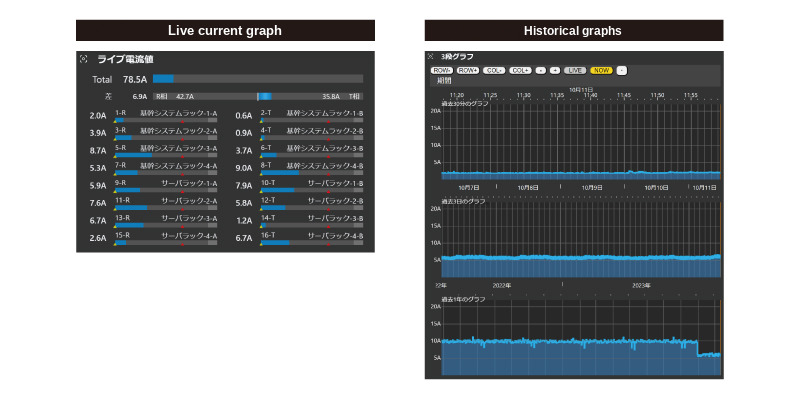
- Displays current usage status and total values in easy-to-understand graphs.
- Measurement interval is 3 seconds, allowing you to quickly check the latest current value.
- Under the standard contract, data at intervals of one minute or less is retained for two months, and coarser data for two years, enabling long-term trend analysis (such as seasonal variations).
- Past data can be compared for analysis.
- Graphs allow zooming in on specified past points, making it possible to compare, for example, the same date and time one year ago.
- Accessible via a web browser and supports multiple devices.
- Upper and lower threshold values can be configured for monitoring. A notification is sent when a configured threshold is exceeded.
- Notifications are delivered by email, Microsoft Teams, Slack, patlite signal tower and SNMP Trap (as of May 2025).
Other Features
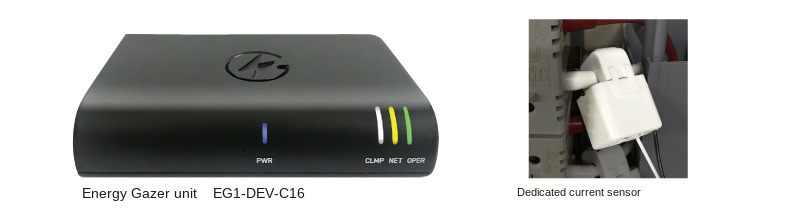
The unit supports both AC adapter power and PoE power supply.
Measured data can also be provided via a Web API, allowing it to be integrated and used within your own systems.
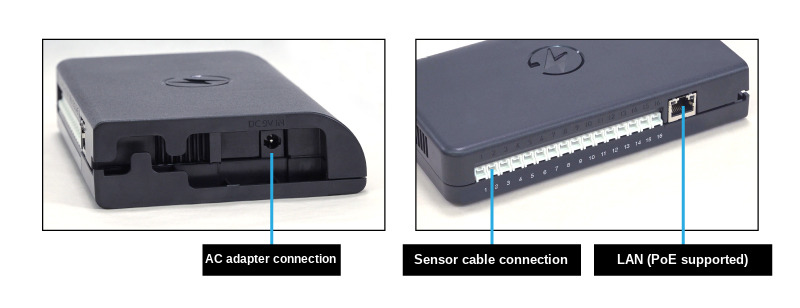
Distribution Board Connection Image
Rack Connection Image
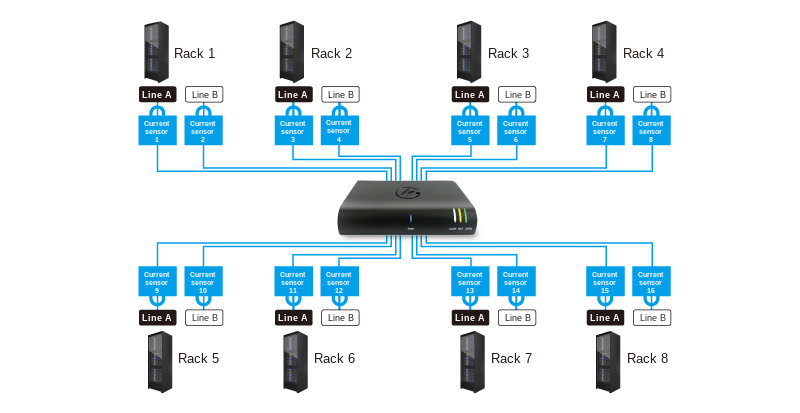
EG Device Main Unit Specifications
| Model Number | EG1-DEV-C16 |
| Product Name | IoT Current Monitoring Device |
| Measurement Interval | 3 seconds Sampling is performed for 100 ms at approximately 700 ms intervals. Every 3 seconds, the average, maximum, and minimum values during that period are output. |
| Measurement Range | The range depends on the attached current sensor. Please refer to the specifications of the current sensor. |
| Number of Measurement Circuits | 16 channels |
| Network | LAN (RJ-45): 100Base-TX / 1000Base-T Wi-Fi: IEEE 802.11 b/g/n/ac 2.4/5 GHz (Supports WPA2-PSK / WPA3-Personal)
Bluetooth 5.0 BLE: Used for connection with the EnergyGazer device setup app (smartphone) |
| Network Settings | The following settings can be configured via the EnergyGazer Device Setup App (iPhone / Android):
|
| Network Protocols Used |
TCP80 may also be used if specifically configured for the on-premises version |
| Estimated Data Traffic When Connected to the Cloud (As of June 2025) | Cloud (EG Server) → EG Device: approx. 1.3 kbps (reference value) Cloud (EG Server) ← EG Device: approx. 2.5 kbps (reference value)
|
| Internal Memory | Can store up to one week of measurement data while connected to the network (Data is lost when the power is turned off) |
| Power Supply |
Supports redundant power operation using both AC adapter and PoE.
|
| Operating Temperature | -20°C to +40°C (Up to -20°C to +50°C with special configuration) |
| Maximum Humidity | 95% RH (non-condensing) |
| Dimensions | 170 × 107 × 34 mm (excluding rubber feet) |
| Weight | 260g |
| Enclosure Material | ABS (Flame retardant, UL94V-0 compliant) |
| Accessories | Dedicated AC adapter |
| Product Warranty | A one-year equipment replacement warranty is included as standard. By additionally purchasing the annual product warranty within the warranty period, coverage can be extended up to seven years. |
| Other | Optional dedicated current sensors and dedicated sensor cable sets are required separately. |
Security Information
We provide information for using EnergyGazer safely, as well as notices of security updates.
EnergyGazer Security Information
If you find a security issue in the product, please report it as described in our Vulnerability Disclosure Policy.
Frequently Asked Questions
Questions we are often asked when customers are evaluating EnergyGazer.
Installation
Can EnergyGazer be retrofitted to an existing distribution board? Do I need to replace the board or change the wiring?
It can be retrofitted. There is no need to replace the distribution board or change the wiring of the power system. You simply clip the clamp-type current sensor onto the outside of the insulation of the wire leading to the breaker, and connect it to the EG Device with a dedicated sensor cable. No special tools are required.
What are the installation steps?
Attach the dedicated sensor to the wire to be measured, connect it to the EG Device with a sensor cable, supply power (AC adapter or PoE), and connect to the network by LAN cable or WiFi. You can then start using the system. When using wired LAN with DHCP, measurement starts without any configuration on the EG Device.
Which power distribution systems are supported?
EnergyGazer supports single-phase two-wire, single-phase three-wire, three-phase three-wire and three-phase four-wire AC distribution systems.
How is three-phase measurement performed?
Three-phase measurement assumes that the phases are balanced: the measured value of a single phase is multiplied by a three-phase coefficient. If you need individual values per phase, this method cannot provide them, so please contact us to discuss your requirements.
How many circuits can a single EG Device measure?
Any number of current sensors from 1 to 16 can be attached to a single EG Device (16 measurement circuits).
How large a system can EnergyGazer scale to?
With the cloud version you can start with a single EG Device and scale up to 1,000 devices (up to 16,000 sensors). With the standard “compact EG Server” of the on-premises version, up to 50 EG Devices and up to 800 sensors are supported; larger deployments are handled with a custom-built EG Server.
How many EG Devices and current sensors are used in a real installation?
Here are actual installation examples.
- A six-storey building including one floor with a PC server room (total floor area 1,200 m²): 10 EG Devices and 140 current sensors covered 90% of the power systems
- A factory the size of three tennis courts: 6 EG Devices and 72 current sensors monitor 100% of the power systems in the factory
- A satellite office: 1 EG Device and 3 current sensors
Measurement
What is the measurement interval?
The measurement interval is 3 seconds. Within each 3-second cycle, a 100 ms measurement is taken approximately four times, and the average, maximum and minimum values are recorded. Results can be checked on screen a few seconds after measurement.
How accurate is the measurement?
EnergyGazer determines the current value using the TrueRMS (true root mean square) method. It measures at a source sampling rate of 2.93 kHz and an equivalent sampling rate of 14.65 kHz (at 50 Hz) / 17.58 kHz (at 60 Hz). Using the dedicated current sensor EG1-CT10-50A, accuracy is approximately ±2% at 50 A.
The high sampling rate maintains accuracy even for distorted waveforms with a large crest factor (CF); approximately ±2% is achieved even at CF = 4.0.
What current range can be measured, and which sensors are available?
Currents from 0.1 A to 1,200 A can be measured, using a choice of nine clamp-type current sensors in three types.
Dedicated current sensors
| Model | Aperture | Measurable range | Recommended range |
|---|---|---|---|
| EG1-CT7-30A | φ7 mm | 0.1 A–40 A | 0.2 A–30 A |
| EG1-CT10-50A | φ10 mm | 0.1 A–80 A | 0.2 A–50 A |
| EG1-CT16-70A | φ16 mm | 0.1 A–120 A | 0.2 A–70 A |
Attenuator-compatible current sensors + dedicated attenuator (EG1-ATT4.7-2 required separately)
| Model | Aperture | Measurable range | Recommended range |
|---|---|---|---|
| EG1-CTA24-250A | φ24 mm | 0.5 A–300 A | 2 A–250 A |
| EG1-CTA36-400A | φ36 mm | 0.5 A–500 A | 2 A–400 A |
Current transformer + dedicated current sensor
| Model | Aperture | Measurable range | Recommended range |
|---|---|---|---|
| EG1-CTR36-700A | φ36 mm | 1 A–800 A | 3 A–700 A |
| EG1-CTR60-700A | φ60 mm | 1 A–800 A | 3 A–700 A |
| EG1-CTR60-1000A | φ60 mm | 2 A–1,200 A | 4 A–1,000 A |
| EG1-CTR100-1000A | φ100 mm | 2 A–1,200 A | 4 A–1,000 A |
Can I choose the length of the sensor cable?
Nine lengths are available: 1 m, 2 m, 3 m, 5 m, 7 m, 10 m, 15 m, 20 m and 30 m. Note that when used with the EG1-CTA series (attenuator-compatible sensors), the maximum measurable current is limited, and only cables up to 7 m are compatible with the EG1-CTA series.
Can I also see energy consumption (kWh) and electricity charges?
Yes. Energy consumption and charges per month, per day and per 30 minutes can be reviewed with the Energy Explorer® function, which also supports searching for peak 30-minute demand values. Because some supply contracts base the monthly fixed charge on the highest 30-minute average power over the past year, this helps you keep track of it.
Note that the power factor required for power display uses a user-configured value, not a measured one.
Data
How long is measurement data retained?
Under the standard contract, data at intervals of one minute or less is retained for two months, and coarser data for two years. Measurement values are aggregated at several granularities from 3 seconds to 1 day and recorded as a time series.
This lets you review both recent fine-grained changes and long-term trends such as seasonal variation.
Can measurement data be exported as CSV?
Yes. From the Live Current Values screen you can download the measurement data for a specified period in CSV format.
- Granularity: every 100 ms / 3 seconds / 1 minute / 5 minutes / 30 minutes / 1 hour / 3 hours / 1 day
- Value unit: A (raw measured value), VA or W
- Specification method: a bulk range from start to end (output together as a ZIP), or a start date/time plus an extraction period (a single CSV file)
- Columns: one column per sensor or group shown on the Live Current Values screen
Sensor groups are not included, because the same sensor values would appear more than once. Nodes with Exclude enabled in Tree Settings are also not included, because they are not part of the current aggregation. To download either of these, select that node itself.
Is data lost while the network is down?
No. The EG Device retains up to seven days of measurement values internally and, once the network recovers, automatically backfills them at roughly 20× speed. Sensor monitoring is also re-run during backfill, and error logs are output with the actual measurement timestamps, so you can review what happened on site during the outage.
Notifications and integration
Can EnergyGazer send notifications when something goes wrong? Which notification methods are available?
You can set upper and lower threshold values and be notified when a threshold is exceeded. As of May 2025, five notification methods are supported: E-mail, Microsoft Teams, Slack, patlite signal tower and SNMP Trap. Notifications can be switched on and off per user group assigned to a tree node.
At what level can monitoring be configured?
High-current and low-current monitoring can be configured for an individual sensor, a sensor group, a specific phase (L1, L2, R, S, T and so on), any node, or the whole system. High-current monitoring is useful for assessing headroom in the power system, and low-current monitoring for detecting that cooling equipment has stopped.
Can EnergyGazer be integrated with external systems?
There are three methods.
- External reference API: log in with administrator privileges to obtain an API token, then read measurement values from monitoring systems such as Zabbix
- MCP server: retrieve measurement values from AI agents that have MCP client capability
- Screen control by link (in development): call a URL from an external system to open a specific node or time range in EnergyGazer
Can EnergyGazer be used from an AI agent?
Yes. An MCP server for EnergyGazer is available, so measurement values can be retrieved from an AI agent program that you prepare.
Network and security
Is network configuration required?
No additional configuration is required when using wired LAN in a DHCP environment. If WiFi settings or a static IP address are needed, they are configured over Bluetooth from the dedicated smartphone app (distributed on the App Store for iPhone and on Google Play for Android).
Both LAN (RJ-45, 100Base-TX / 1000Base-T) and Wi-Fi (IEEE 802.11 b/g/n/ac, 2.4 GHz / 5 GHz, WPA2-PSK / WPA3-Personal) are supported. In the 5 GHz band only W52 (channels 36/40/44/48) is supported, and because DFS is not implemented, 5 GHz use is limited to indoor environments.
How much network traffic does EnergyGazer use, and which ports are required?
As a guide, cloud connection traffic is approximately 1.3 kbps downstream and 2.5 kbps upstream (reference values as of June 2025). This varies with the measured current values and with product updates, and increases after network recovery and during firmware updates.
The protocols used are UDP 53 / TCP 53 (DNS), UDP 123 (NTP) and TCP 443 (WSS). TCP 80 can also be used with the on-premises version if specifically configured.
How are users authenticated?
The cloud version supports two-factor authentication, Passkey and Google authentication.
In addition, when a sensor’s measurement screen is shared using the QR code link function, the security level for access can be chosen from three options: login required, PIN code required, or free access.
Key features
What is Dynamic Summary®?
Dynamic Summary® stores the data from every individual sensor as it is recorded, and then aggregates any combination of sensors in real time when the data is viewed (patent pending).
Most measurement systems record only the result of an aggregation decided in advance, in order to limit the volume of data. However, deciding a sensible aggregation before you have actually measured the current is difficult, and it demands experience at the planning stage.
With Dynamic Summary® you can work in the following way.
- Start by simply measuring the current of every power system
- Watch how the measured current values actually change, then consider which combinations to aggregate
- The aggregation can be rearranged at any time, and past data can also be reviewed with the rearranged aggregation
This lets you view aggregations per site (head office, branch, factory and so on) and company-wide aggregations (all air conditioners, all lighting, all office equipment, all production equipment) at the same time, as separate perspectives.
Configuration and contract
What is the difference between the cloud version and the on-premises version?
The difference is whether the EG Server, which collects and records the measurement values, is on the internet or inside your own network. A subscription contract is required to start using either version.
| Cloud version | On-premises version | |
|---|---|---|
| EG Server | Uses the EG Server on the internet | A computer with the EG Server software pre-installed is delivered |
| Server installation and operation | Not required | Installed and operated by your organisation |
| Monitoring scope | EG Devices can be installed, and viewed, anywhere with an internet connection | Within your own network only |
| Scale | From 1 EG Device up to 1,000 devices (up to 16,000 sensors) | Up to 50 devices and 800 sensors with the standard compact EG Server; larger deployments use a custom-built EG Server |
| Licensing | Annual cloud connection licence plus annual cloud user licences (renewed each year) | Perpetual on-premises connection licence. The compact EG Server includes perpetual licences for 20 users |
| Cost characteristics | Lower initial cost | Lower annual cost |
An EG Device can also connect to two EG Servers at the same time. Because the same measurement values are recorded on servers belonging to different organisations, one can be managed company-wide while the other stays under departmental management.
Installation environment and safety
What are the installation environment requirements?
The specifications of the EG Device main unit are as follows.
| Item | Specification |
|---|---|
| Operating temperature | −20 °C to +40 °C (−20 °C to +50 °C on request) |
| Maximum humidity | 95% RH (non-condensing) |
| Dimensions | 170 × 107 × 34 mm (excluding rubber feet) |
| Weight | 260 g |
| Enclosure material | ABS (flame retardancy UL94 V-0) |
Installation inside a distribution board or in a server rack is assumed. A DIN attachment (EG1-AC-DINATT) and a magnet attachment (EG1-AC-MAG) are available as mounting options.
Note that when the 5 GHz WiFi band is used, DFS is not implemented, so use is limited to indoor environments. The catalog does not state whether outdoor installation is supported, so please contact us if you are considering it.
What safety considerations are built into the product?
To help keep sensor installation on a distribution board and EG Device installation safe, the product is designed as follows.
- EG Device main unit — a resin enclosure with no exposed metal parts such as screw terminal blocks. Sensor cables connect with a single touch using resin connectors. The enclosure uses resin that meets the UL94 V-0 flame retardancy standard
- Dedicated sensor cable — resin connectors are fitted at both ends and no metal parts are exposed. The flame retardancy standard is UL VW-1
- Dedicated current sensor — with a transformer-type current sensor, attaching it to a live wire while nothing is connected to its output generates a high voltage and is dangerous. This is not an endorsement of connecting while live, but the sensor includes an overvoltage protection circuit in case it is connected while live by mistake
Installation itself is clamp-based: the sensor simply clips onto the outside of the wire insulation. There is no need to change the wiring of the power system, and no special tools are required.